The Summary:
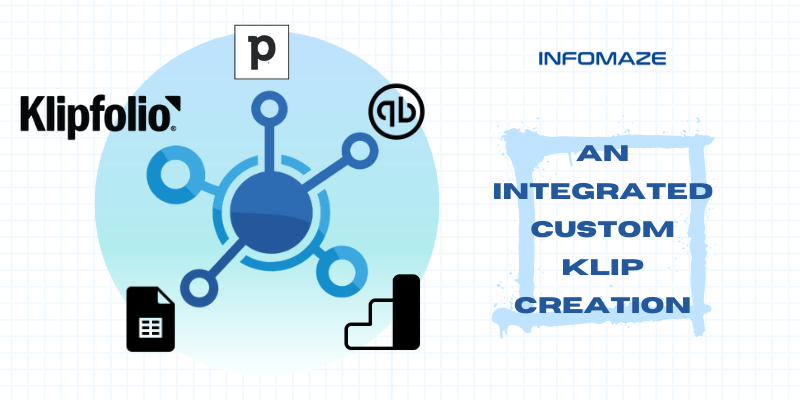
The client, an enterprise home decor and accessories provider, was looking for a way to access and analyze all of their enterprise departmental data in real-time. Infomaze helped them reach their goal by integrating all of their applications, including QuickBooks Desktop, Pipedrive, Google Analytics, and Google Sheets, into Klipfolio Dashboard.

In addition, we created departmental-wise dashboards with user-based secure access to the custom Klips. The integration that we provided gave them an overview of the functionality of their business, an endless opportunity to overcome their shortcomings in time and prevent losses that otherwise would be difficult.
The Challenge:
The client provided bath fitting and plumbing accessories to a broad range of customers, including multistory residential housings & individual residential households, Commercial setups, multinational companies, and the hotel industry, among their top lists. As a result, the amount of data the company acquired in their day-to-day business was immense and required a systematic, easy way to gain impactful insights that would help their business grow further.
The customer used multiple applications to maintain, sort, and record their client data. However, from leads, sales, marketing campaigns, inventory to accounting, the applications used remained disconnected from one another, and drawing business conclusions for every department was no easy task requiring more workforce hours and energy.
In addition, the silo that existed between the departments meant ineffective communication, delays in supplies, and cancellation of orders, ultimately leading to customer dissatisfaction. Finally, as their business grew, the client realized the lack of integration between the business applications they used to gain meaningful measures for their business.
The Requirements:
The client required an automated workflow by eliminating the miscommunications and breaks between the departments and integrating the multiple applications used.
Departmental-wise data highlighted to make decision-making easier for stakeholders, department supervisors, and individual employees with access-based selective information.
Help to choose the right platform to achieve the desired integration of data sources and defining the prominent KPIs to access their business growth through a unique and efficient Business Intelligence Application Dashboard.
The client had the following applications that needed integration into a single platform:
- QuickBooks Desktop used to maintain their inventory and accounting
- Pipedrive to handle their Sales and sales pipeline.
- Google Analytics to nurture lead generation and their loyal clientele by optimizing their website and social media platforms.
- Google Sheets to maintain the information of various vendors.
The Solution:
The client had a clear idea of what they wanted on their dashboard. Still, amongst the many options available in the market for a BI solution, Qlikview, Klipfolio, and Microsoft Power BI, they explored and needed a consultation. Hence when they sought us, we helped them narrow down their choice to Klipfolio based on their requirements.

As the client preferred QuickBooks Desktop over QuickBooks Online, they were not ready to move even though the integration process would have made simpler with QuickBooks Online. As QuickBooks Desktop Integration with Klipfolio is not straightforward due to the lack of API provided by Klipfolio, we improvised. We used the QuickBooks Web Connector to create a connector to integrate QuickBooks Desktop-Klipfolio seamlessly with periodic automated real-time updates of their inventory and accounting.
Our Klipfolio experts created a dashboard, Klip exclusively for the accounts and the inventory department using the Klip editor for custom visualizations.
The Pipedrive Klipfolio integration was relatively straightforward using the Pipedrive-Klipfolio service connectors and custom Klips that we created to follow up on their sales and predicting their sales forecast, along with the additional data source connected through data from QuickBooks. We integrated Klipfolio-Google Analytics by customizing the Klipfolio Connectors, creating the custom data source with our query. In addition, we added multiple data sources to showcase the user views, time spent, and other measures on a single Google Analytics Klips as per the client’s needs.
As the client maintained their vendor information on google sheets, we integrated it with Klipfolio. We set up the functions to format the data as per the client’s needs using the pre-built connector and custom-designed the Klips.
The Result:
The client got what they had asked for, and more in less time than anticipated, and was overall happy with the outcome. In addition, the client’s request to eliminate the silos between the departments was efficiently dealt with, and the departments, including the operations, sales, marketing, and executive stakeholders, benefitted from our solution.

The Operations Department:
Obtaining an outsourced IT help desk solution provider renders the need for expanding unnecessary infrastructure while getting the job done efficiently.
The Sales Department:
To monitor the Sales year to date (YTD), Sales forecasts and the actual targets reached, the breakup of various sales personals performance over the year, sales by-products, sales by invoices, back books, backorders, the deals cracked by the salesperson, number of contacts and sales activities based on the area were categorized.
The above-mentioned categorized data could be quickly and efficiently understood with the snap view of the dashboard created from combining the data sources from Pipedrive and QuickBooks, giving the stakeholders an upper hand while making business impactful decisions.
And, the Klip also helped to view the estimates projected, and actual estimates achieved, top estimates by value dept wise functions, profit month by month, year or weekly as per the stakeholders choosing.
With the help of the custom Pipeline Klip that we created, the sales department utilized the funnel chart Pipeline tracker for monitoring the number of ongoing deals, the number of quotes sent, and deadlines to close the sales on a priority.
The Marketing Department:
We helped the marketing department by integrating Google Analytics using the campaign model into Klipfolio. The Klip aided in understanding the viewers visited, the bounce rate, number of sessions, average session duration, percentage of new sessions, sessions by channel, pages per session, goal completions, and goal conversions achieved through the website.
The Vendor Management Office:
With the Google sheets integrated into the Klip, the client could easily track the vendor details, track inaccuracies, and the satisfaction achieved through the dealings with the vendor. The automatically updated vendor information Klip helped them effectively in vendor management.
Conclusion:

With the implementation of the solution we rendered, the client has successfully seen an increase in their performance efficiency, ROI, and profit margin.
Cutting down on the losses due to eliminating miscommunication and disorganization was the key. The client is currently planning to bring the Klipfolio BI solution into the other organization’s departments and discuss it with our Klipfolio experts.
With the experience in creating insightful Klipfolio dashboard Klips for multiple industries, including hospitality, eCommerce, and B2B, we have the expertise and real-life experience to tackle massive amounts of data for enterprises and even SME’s to create meaningful BI solutions.
Click The Below Link For More Details
Comments
Post a Comment